Overview
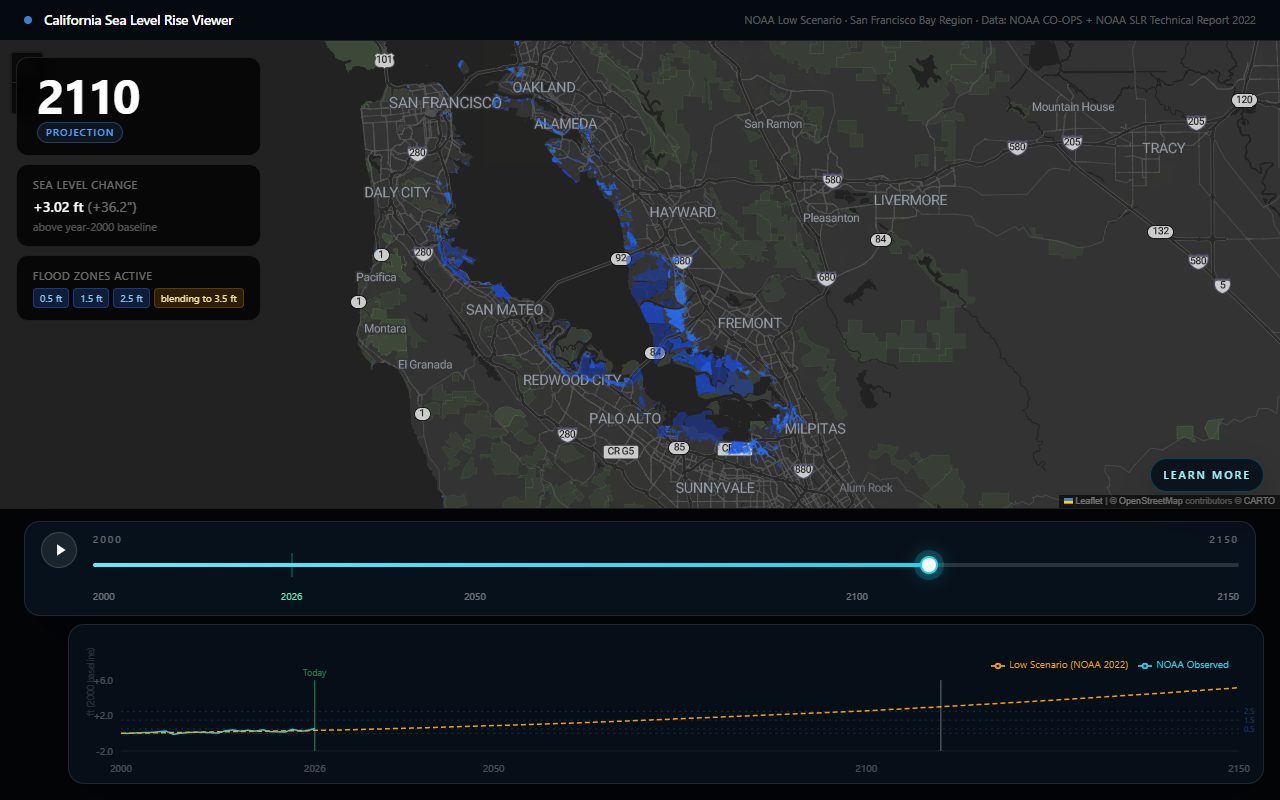
Built at MV Hacks 9.0, this is an interactive map that visualizes projected sea level rise for the San Francisco Bay Area over a timeline, overlaid with historical NOAA tide gauge data. A draggable timeline slider scrubs through years to show how the coastline’s inundation footprint is projected to change.
Features
- Interactive Leaflet map with sea-level-rise inundation layers for different water-level scenarios
- Timeline slider spanning historical and projected years
- Tide chart showing NOAA monthly mean sea-level data for the San Francisco station
- Info panel summarizing projected sea-level rise and map state for the selected year
- Playback mode that animates the timeline automatically
- Resource links panel for further reading
How it works
The frontend is a Next.js/React/TypeScript app. SeaLevelViz is the top-level client component: it tracks the selected year, fetches NOAA historical monthly-mean tide data, and derives the projected sea-level-rise value and active map layers for that year via lib/slrProjections.ts. The map itself is a dynamically-imported Leaflet component (MapComponent) that renders pre-generated GeoJSON inundation layers, produced by a Python script (scripts/generate-geojson.py) from source sea-level-rise datasets.